The World Observatory on Subnational Government Finance and Investment: Making Fiscal Decentralisation Work
The World Observatory on Subnational Government Finance and Investment, also known as SNG-WOFI, is a multi-stakeholder initiative launched in 2017 led by OECD and UCLG, with support from UNCDF, AFD, CEB and DeLoG.
The objectives of this initiative include:
- ensure standardised, reliable and transparent access to data on subnational government structure, finance and investment;
- support dialogues and decision-making on multi-level governance and subnational finance;
- serve as a capacity-building tool for governments and relevant stakeholders.
Compared to the pilot study in 2016, the latest 2019 edition has expanded coverage to over 120 countries, which represent 86% of the world’s population and 89% of world GDP. It is the largest international database on subnational government (SNG) structure and finance ever produced.
Key Findings
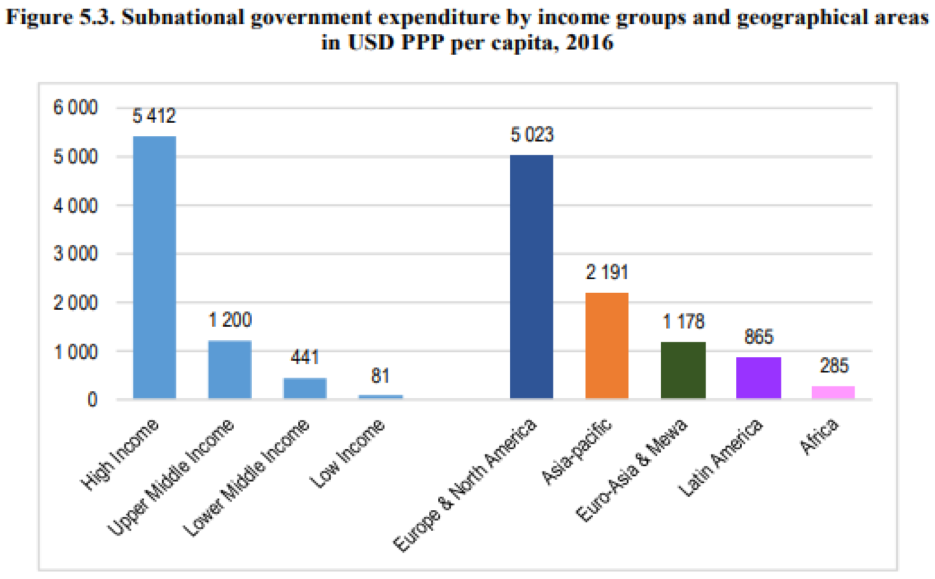
Subnational government expenditure
In 2016, subnational government expenditure represented 24.1% of total public spending and 8.6% of GDP on average. In general, high income countries tend to have higher local expenditure than low income countries. The difference is quite significant.
Staff expenditure is the most important expenditure item, accounting for 34.7% of total public staff costs. At the global level, education, social protection, general public services and health are the primary areas of SNG spending. But lack of clarity in SNG responsibilities remains a big challenge, sometimes leading to competing and overlapping competences and a lack of accountability.
Subnational government investment
Subnational governments play a key role in public investment. The share of total public investment is mainly higher in high and upper middle-income countries, around 50%; but in Africa is less than 20%. However, the share of subnational public investment in GDP remains low in many countries, only 1.3% around the world. It’s even less in low income countries, for example 0.9% in Africa. In OECD countries, subnational public investment was declining for 8 years following the 2008 crisis, but significant catching up is still needed.
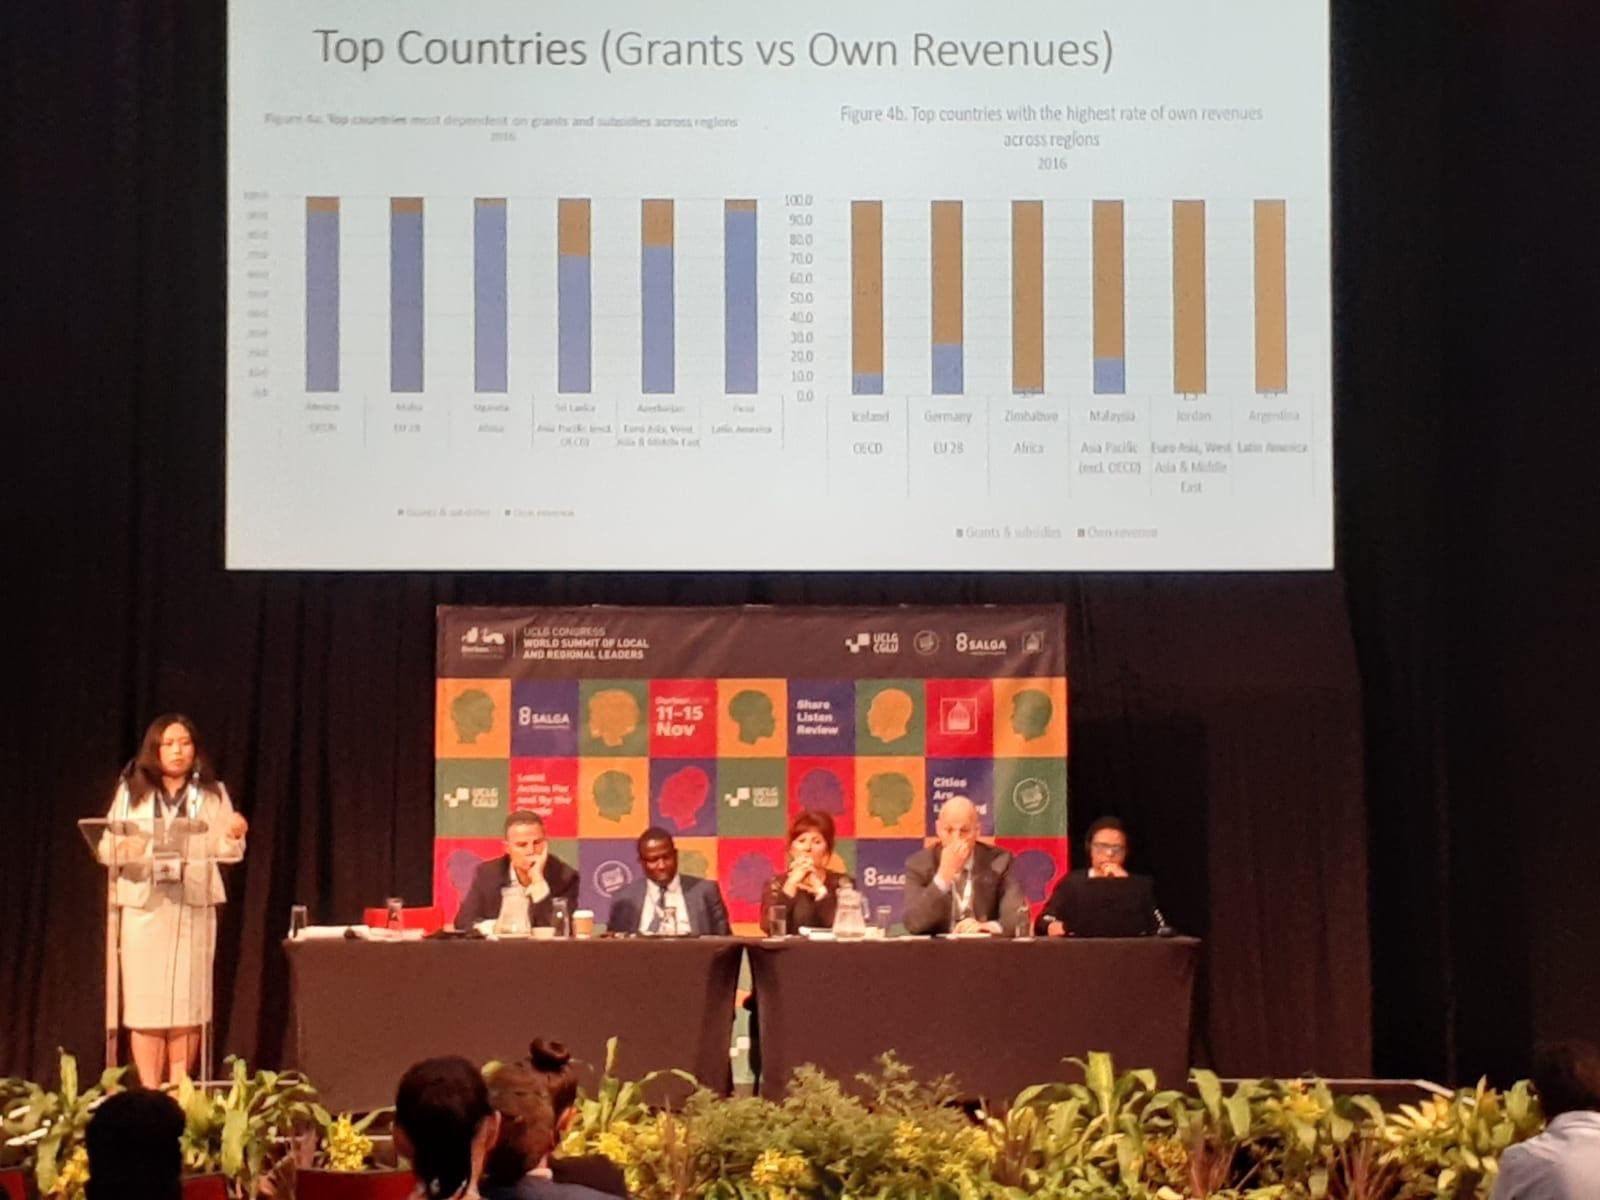
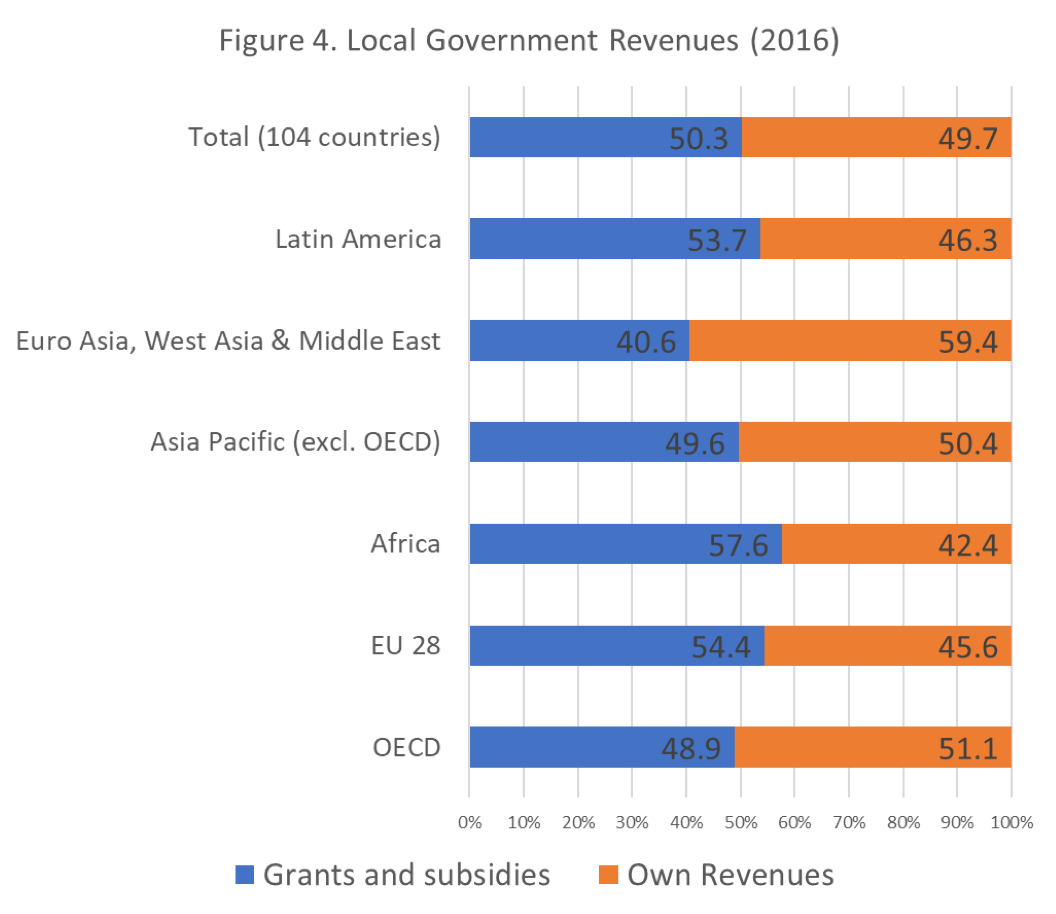
Subnational government revenue
On average, subnational government revenue represents 25.7% of total public revenue and 8.6% of GDP. Grants and subsidies are the primary source of revenue in many countries around the world, representing 50.3% of their revenue, and even more in low income countries. Tax revenues are the second largest source of income, accounting for almost 1/3 of SNG revenue. This is followed by user charges and fees (8.9%) and property tax, around 2%. However, the breakdown between sources of revenue varies greatly from one country to another.
 Least Developed Country (LDC) subnational finance and investment
There is very limited SNG fiscal data available in LDCs, sometimes only partial and irregular data. Subnational government expenditures account for a low share of GDP, some less than 1%, few countries between 3-6%. Most LDC local governments have limited spending autonomy. Investment accounts for a small share of total subnational expenditures. Without sufficient self-financing and adequate capital transfers, local governments remain unable to cope with huge investment needs.
Local governments’ revenues in most LDCs are highly dependent on central government transfers around 90%. The share of local tax revenue is limited. Most local governments face difficulties in mobilizing and defining their own resources. Borrowing is generally allowed at local level to finance capital investments upon approval of the ministry of finance, but in practice is very limited and represent no more than 1% of public debt in every LDC.
