Where in the World is Mobile Money Prominent?
While the GSMA data shows the first mobile money provider launched in East Asia and the Pacific in 2001, it was M-PESA’s March 2007 launch in Kenya that popularized the model. Since then, almost all successful mobile money operations have been built in M-PESA’s image. Shortly thereafter, Vodacom launched M-Pesa in Tanzania in April 2008, MTN launched in Uganda in March 2009, and MTN launched in Rwanda in February 2010.
In 2011, five years after M-PESA launched in Kenya, almost all the success was still achieved in East Africa, fueled by the operations in these leading countries. GSMA’s State of the Industry Report that year identified only eight fast-growing operations globally, six of which were in East Africa. These operations were buttressed by many of the pioneers of M-PESA that spilled over Kenya’s borders to keep building frontier systems.
Further, data from Somalia is rarely included in the World Bank’s Findex or the GSMA State of the Industry Report. Therefore, the country’s contribution to the mobile money sector is often under-appreciated even though operations should be included in this vanguard of innovation in East Africa. Telesom ZAAD launched in Somaliland in 2009 and Hormuud launched EVC Plus in Somalia in 2011. 2014 was the only year in which Somalia was included in the Findex, at which point 37% of adults had a registered account, the second highest rate in the world after Kenya. This means East Africa’s contribution to the initial growth of mobile money is even more paramount than generally acknowledged.
However, beyond these success stories in East Africa, there has been notable success in other regions as mobile money has expanded to almost 100 countries globally. This article analyzes the GSMA dataset to help tell the story of how mobile money has expanded around the world.
Half of Providers have been in sub-Saharan Africa Consistently for a Decade
The chart below displays the percentage of mobile money providers by region as defined by the GSMA for the last 20 years. There is a lot of volatility in the first decade of data from 2011-2010. However, these fluctuations are not particularly significant as there were only 35 total providers in 2009 and 67 in 2010. In 2011, there are finally 111 providers, which is a more stable base from which to measure meaningful changes in regional dynamics.
The major insight is that from 2011 through 2021 there has been very little change in the percentage of providers per region. The data shows that currently all regions are within four percentage points of where they were in 2011 and there has been little fluctuation within the period. It is surprising that sub-Saharan Africa (SSA) does not increasingly comprise a smaller proportion of the operations as mobile money is dispersed across the world. Between 47%-54% of operations have been in sub-Saharan Africa consistently for the last 13 years (since 2009).
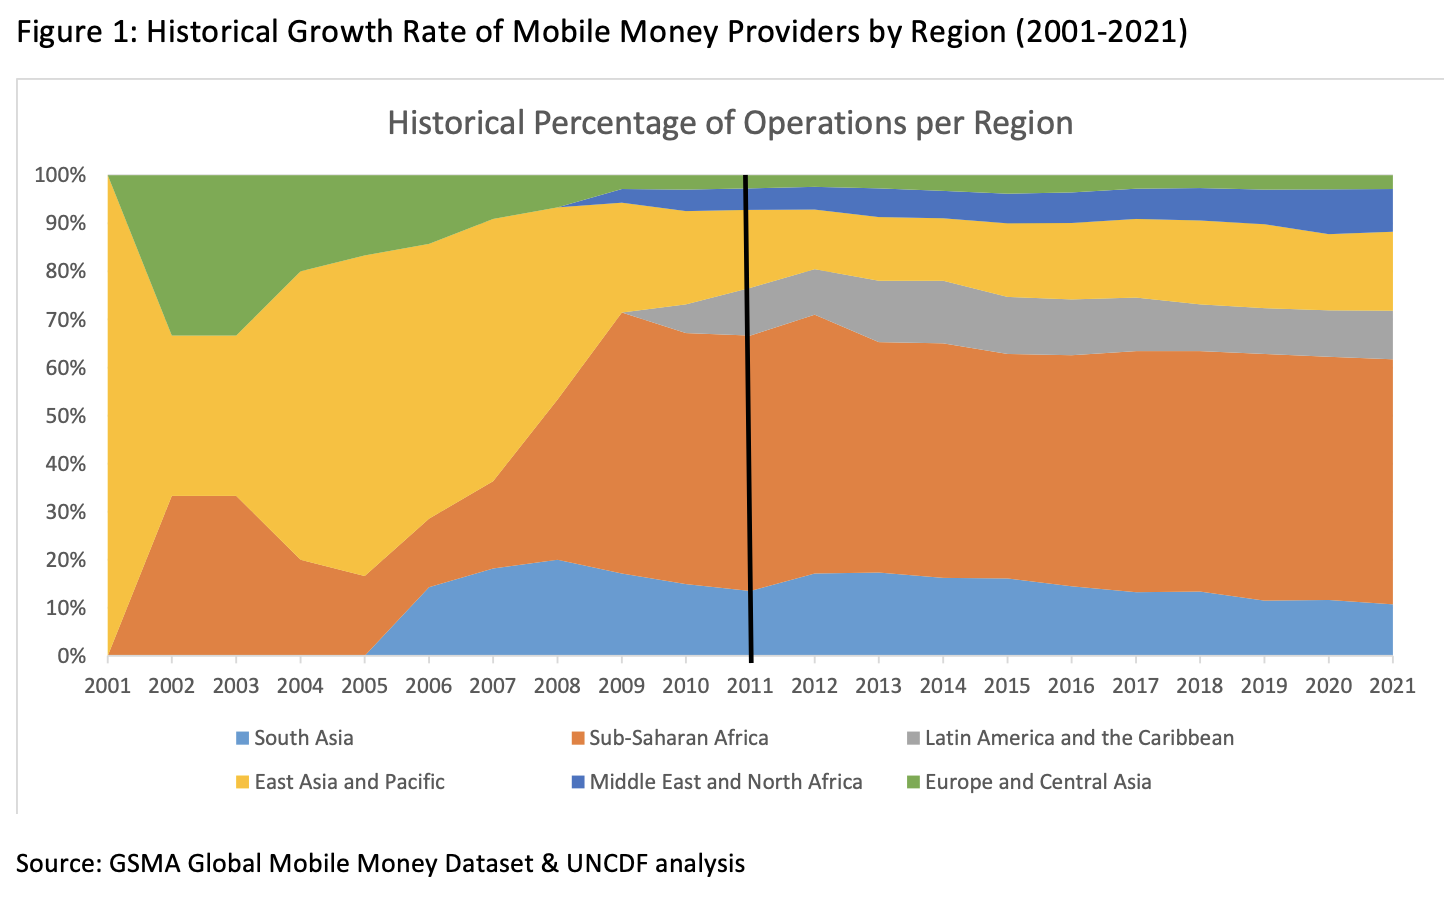
In 2021, 51% of mobile money providers were in sub-Saharan Africa. Unfortunately, GSMA does not provide sub-regions for SSA in the provider analysis as it would be interesting to map how different African regions contributed to this growth. UNCDF hypothesizes that it has been the emergence of operations in West Africa and Central Africa more recently, that have kept the SSA growth rate increasing in lockstep with other regions around the world.
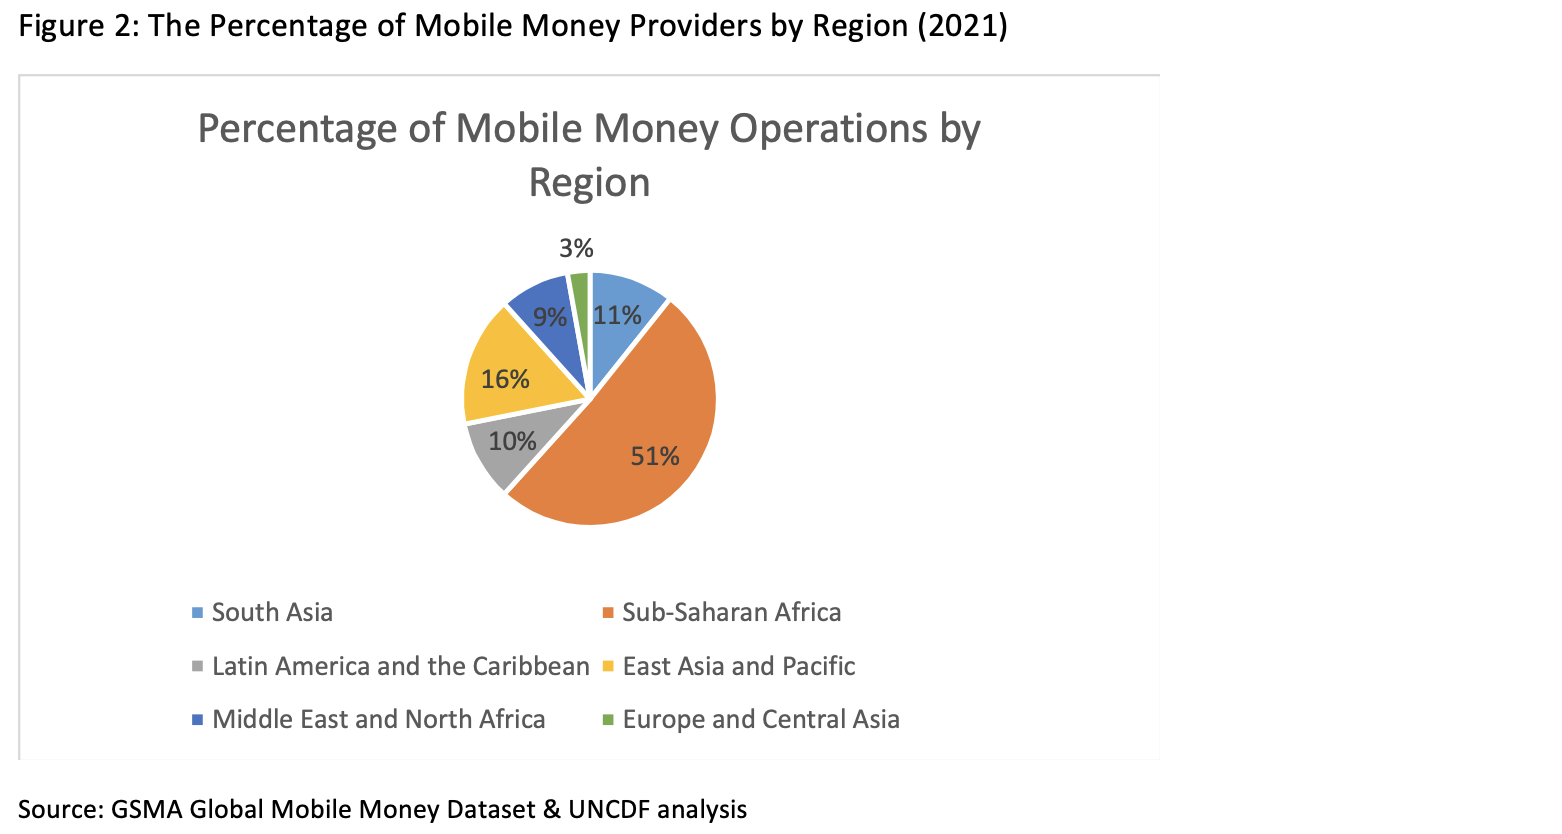
Overall, the provider data shows that SSA has remained the dominant region for mobile money operations since 2011 when there were enough mobile money operations to make this analysis meaningful. Currently, over one out of every two operations are in the SSA region. However, there are four other notable regions that each have about ten percent of providers as well. These regional proportions are unlikely to change significantly given the global provider growth rate has averaged 2% annually for the past three years.
92% of Active Customers are in Three Regions of the World
The number of providers per region is just a preliminary indicator of the dispersion of mobile money. It is more important to understand where people are using it. Analyzing the 30-day active customers by region produces further insights. First, while the provider analysis shows five regions that have a significant number of providers (at least ~10%), this active customer analysis reveals that there are only three regions that significantly contribute to active customers: sub-Saharan Africa, South Asia, and East Asia and Pacific.
Together, these three leading regions account for 92% of 30-day active customers globally, anchored by the SSA region which accounts for 53% of active customers itself. Of the 30-day active accounts in SSA, 89% are in the two sub-regions of East and West Africa. Lastly, while the regions of the Middle East and North Africa and Latin America, and the Caribbean each have about 10% of providers, those providers only account for 1% and 6% of active customers respectively.
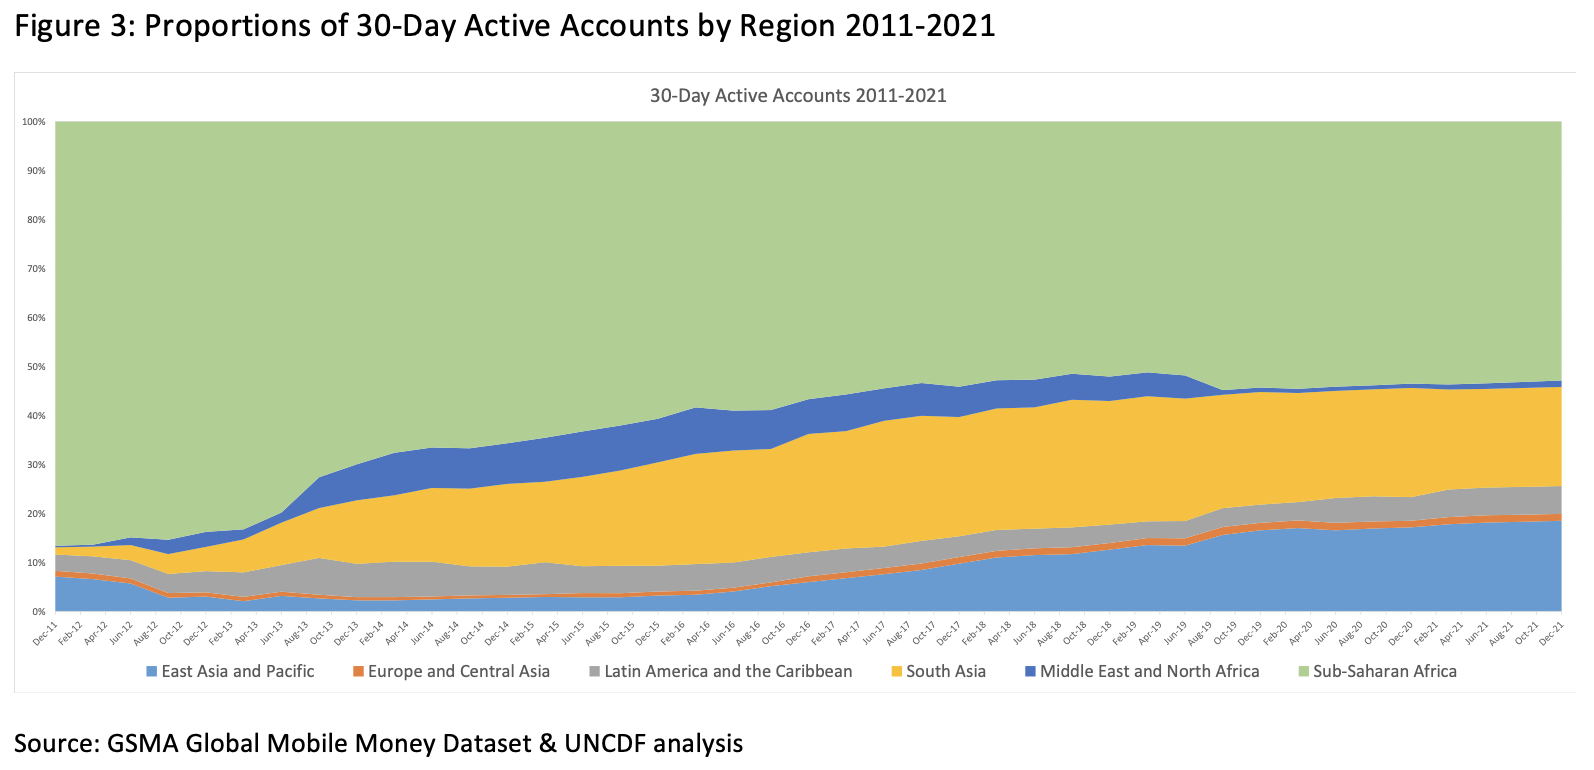
The historical perspective shows that in December 2011, 87% of 30-day active customers were in SSA. 84% of them were in East Africa, and West Africa added the additional 3%. Relative gains made in South Asia and East Asia and the Pacific regions eroded this dominance in the period between 2011-2017. However, from 2017 (for the last five years), SSA’s proportion of active customers has stabilized in the mid-fifty percentile range. These regional proportions are also unlikely to change significantly given the declining global growth rate in 30-day active customers.
South Asian Providers Have Twice the Active Customers of Other Leading Regions
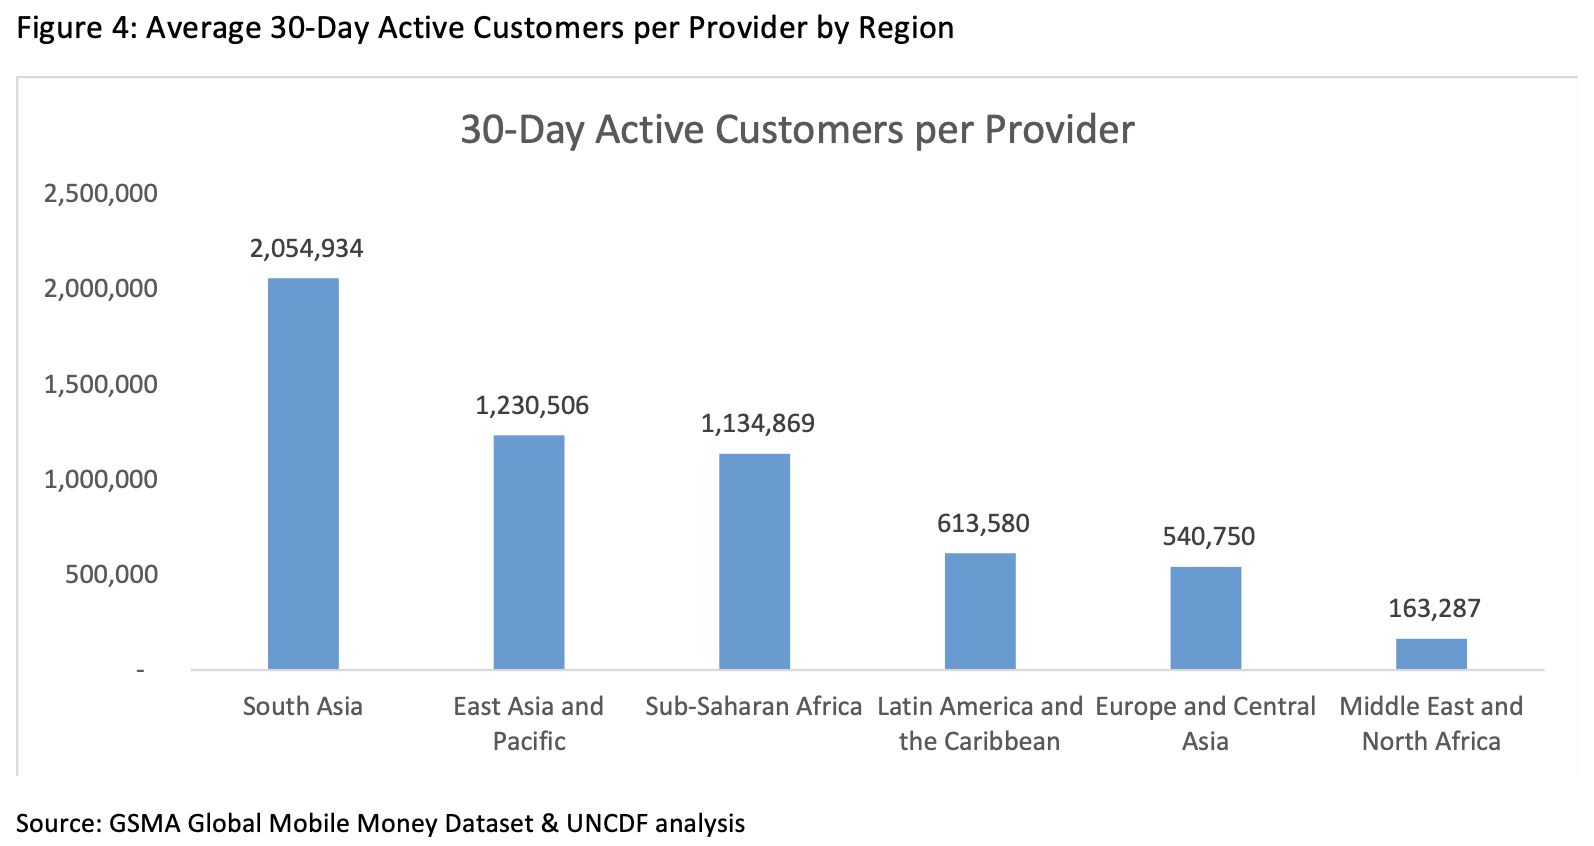
The average number of 30-day active customers per provider is a good indication of the level of profitability of providers in different regions and displays the prominence of a region outside of Africa.
South Asian providers have the largest number of 30-day active customers per provider, which is about twice as many as the other two dominant regions (SSA and East Asia and the Pacific). However, this could be an artifact of the regional definitions. If East and Western Africa were considered their own regions, they would display significantly higher ratios (GSMA does not provide figures for these).
It is enticing to surmise that the South Asia and East Asia and Pacific regions have more active customers per provider because there are larger populations in those regions where providers have more customers to serve. This likely plays a role in explaining these differentials. However, it does not explain why the differentials are not in proportion to the population. For example, in the region of South Asia, Pakistan, Bangladesh and India all have populations that are much more than twice as big as the average SSA country, so why do providers there only have twice as many active customers on average?
Part of this answer may be a result of how transactions are conducted in different parts of the world. In Africa, it is common for providers to register customers that make transactions while in regions like Latin America and South Asia, many customers use over-the-counter (OTC) methods. That means they may conduct transactions without registering with the provider. Thus, these users may not be captured in 30-day active customer statistics, but their transactions and use of agents would be, which are examined next.
95% of Active Agents are in Three Regions of the World
The number of 30-day active agents deepens this analysis as agents can serve OTC customers and are another helpful indicator of the prevalence of a service. The active agent analysis is not as clean as the active customer analysis, as supply-side data generally does not measure unique agent outlets, but merely the number of tills (transaction devices) in use. This means in countries where various providers are operating, there are often multiple tills in unique outlets, and therefore a much larger number of tills than unique outlets. The measurement in the GSMA data is of tills not unique agent outlets.
The active agent analysis shows a similar dominance of the same three regions where active customers are located, with each region having similar proportions of active agents to their proportions of active customers. For example, in December 2021, SSA had 54% of active agents and 53% of active customers. This is an indication that OTC customers are not significantly different across regions. If they were there would have likely been a greater proportion of active agents to active customers in regions where OTC is common. Conversely, the reverse is true in the Latin America and Caribbean region, which has 6% of active customers, but only 3% of active agents.
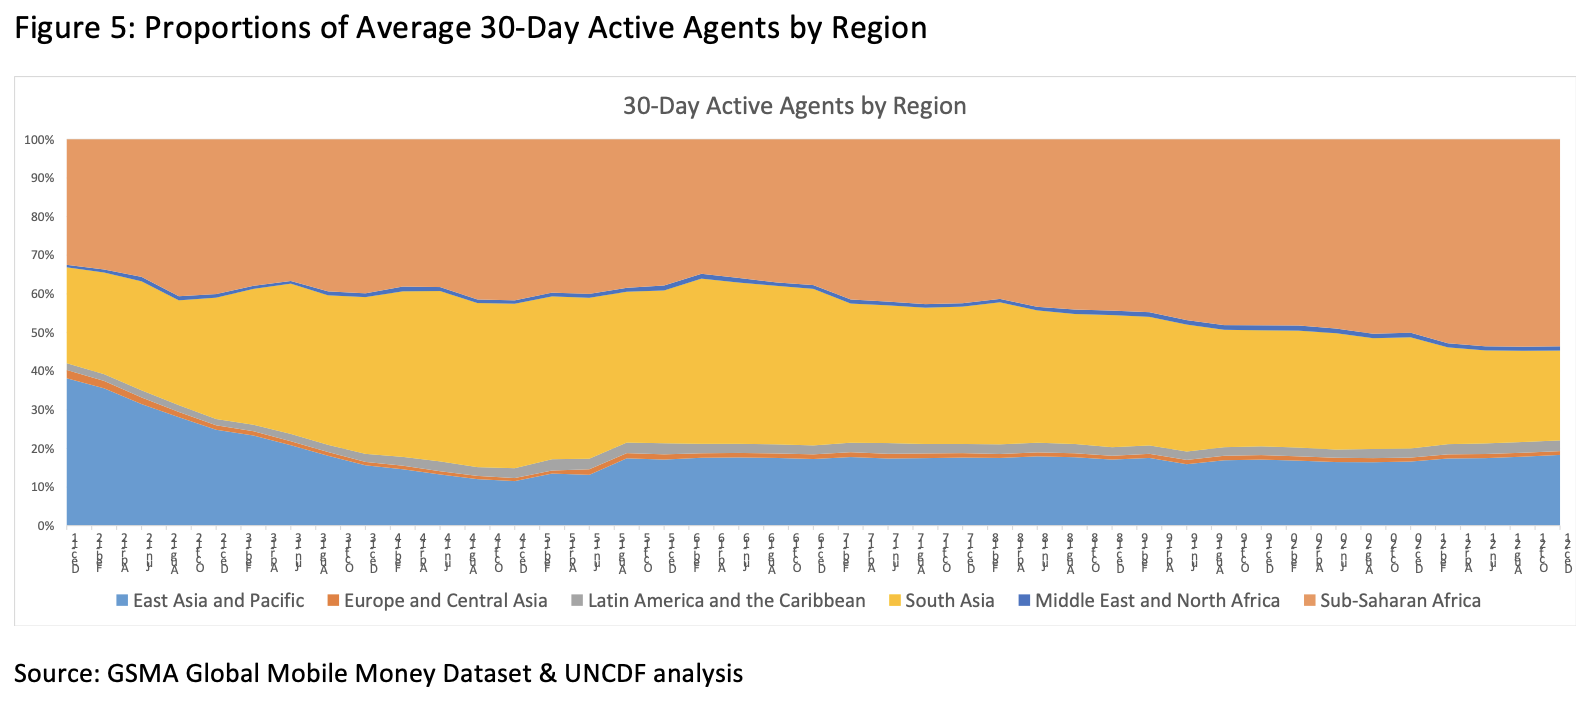
The historical analysis is puzzling as the proportion of active customers in SSA declines over time, whereas the proportion of active agents in the region increases. In December 2011, SSA had 87% of active customers, but only 32% of active agents. The proportion of active customers in SSA declined until 2017 and then stabilized. However, the proportion of active agents in SSA has been increasing steadily since 2016.
Examining the sub-regions in Africa shows that East Africa’s proportion of global agents has remained at about a quarter of the global total since 2015, and the growth has come from West Africa, which has grown its proportion by 160% since 2016. It is unclear why West Africa has grown its active agents faster than its active customers over the past several years, which remains a mobile money mystery for now. It could be related to increasing OTC transactions or decreasing tills per unique outlet among other variables.
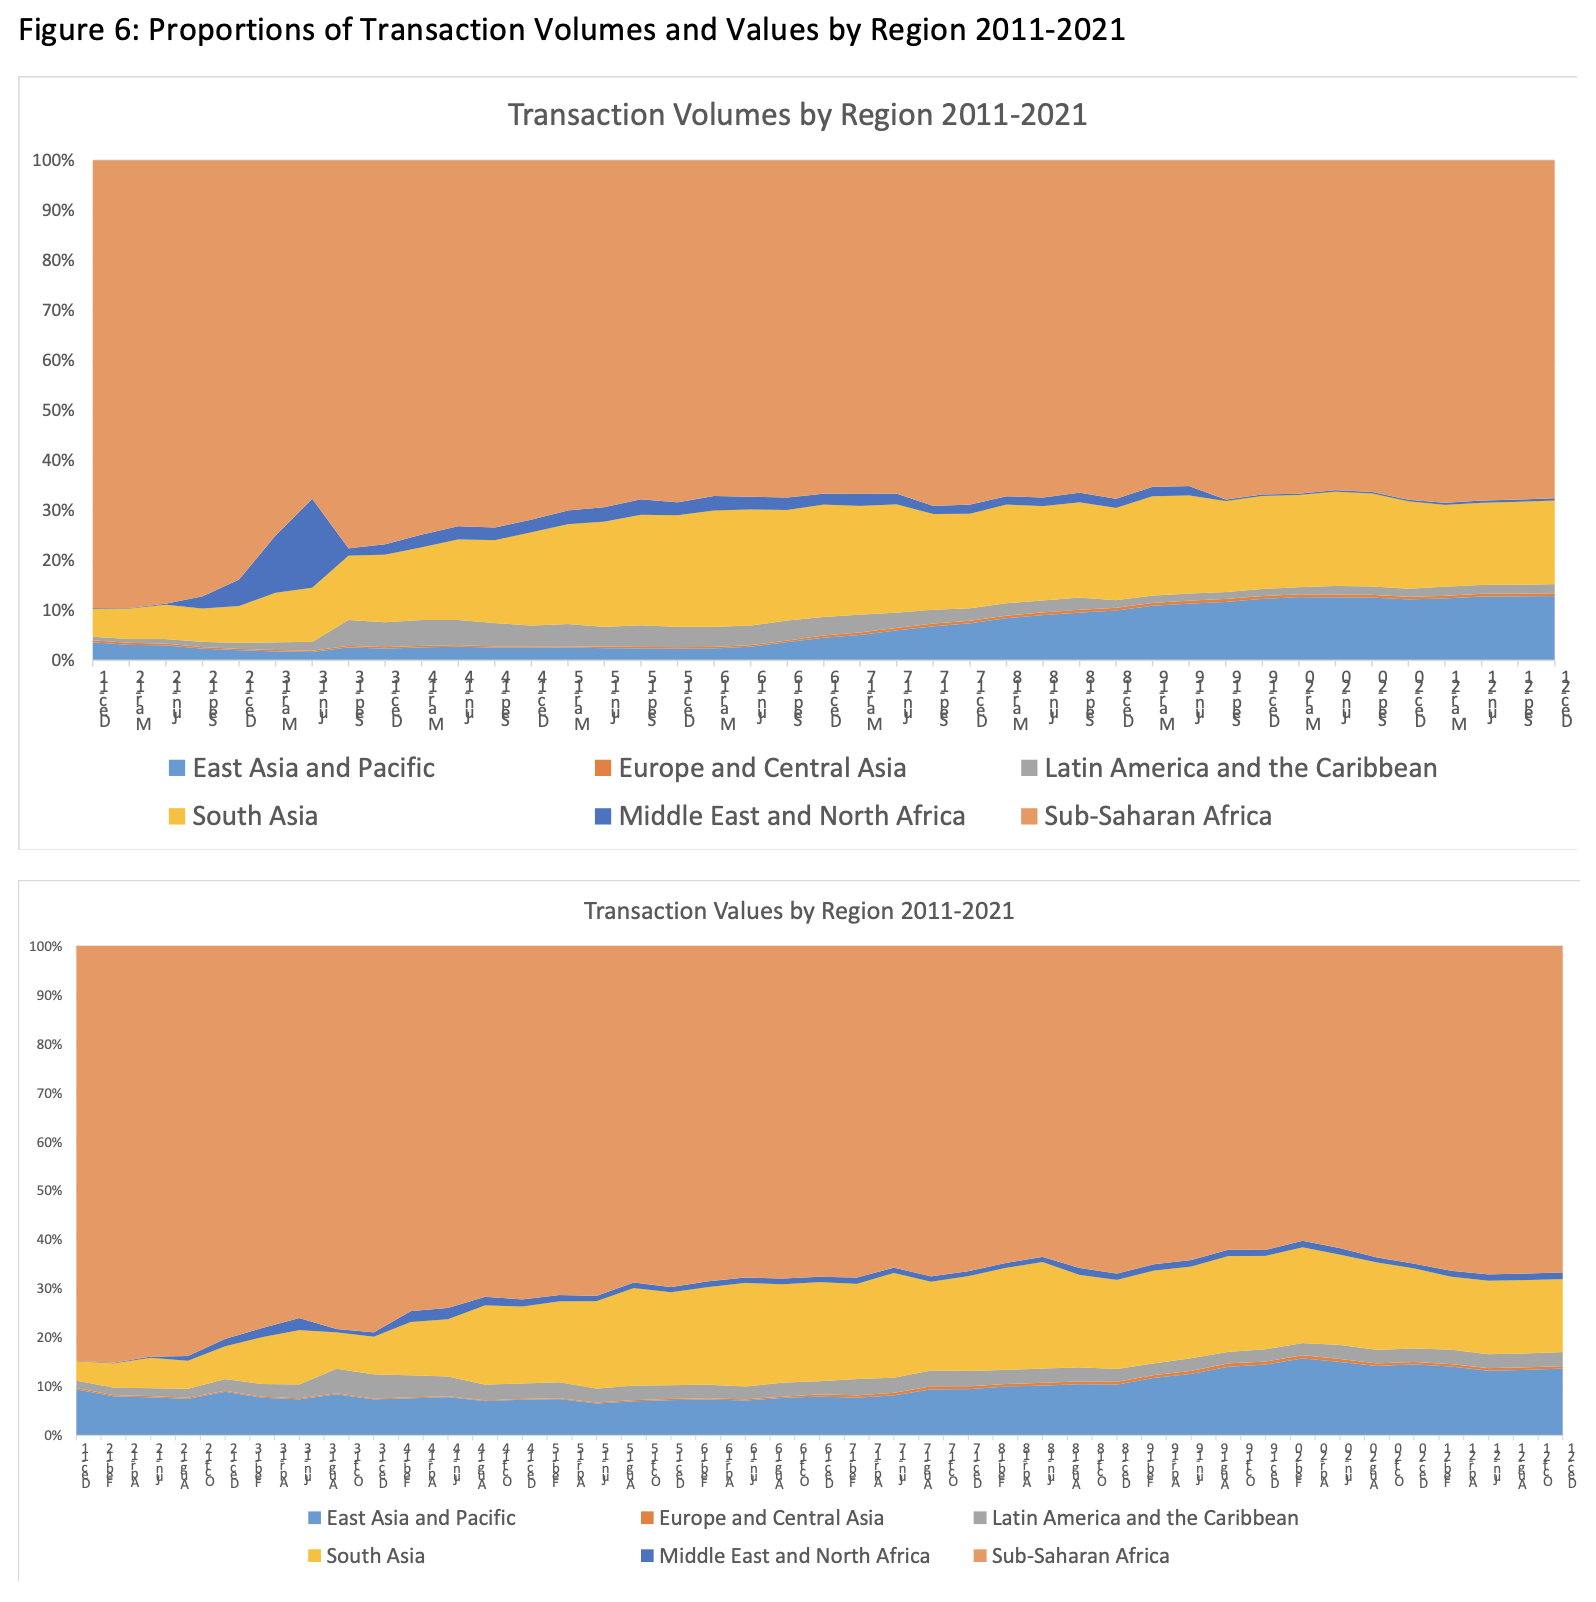
Two of Every Three Mobile Money Transactions Occur in sub-Saharan Africa
The historical transaction trends are like those for active customers. At the end of 2011, the SSA region accounted for 90% and 85% of transaction volume and values respectively, but the proportion of transactions in this region declined significantly through 2015. For the last six years, since 2016, SSA has maintained a static proportion of transactions compared to other regions. Lastly, there are only three regions that hold a significant proportion of transactions.
The difference in the indicators is that SSA holds a significantly more dominant proportion of transactions than it does of active customers. The SSA region had four times more transactions than any other region of the world. While just over half of active customers are in SSA, the region accounts for two-thirds of global volumes and values. This indicates that an active customer in SSA transacts significantly more frequently than active customers in other regions. This is a key difference between regions and should be better understood as how to increase the frequency of transactions per customer has been one of the great unsolved mobile money mysteries.
Sub-Saharan Africa Still Is and Will Likely Remain the Epicenter of Mobile Money
Mobile money was popularized in sub-Saharan Africa and the provider analysis shows that it has scaled globally. However, while there are five regions where there are a significant number of providers offering the service, there are only three regions where there are a significant number of customers using the service or CICO agent networks to support them. Providers in the regions of South Asia and East Asia and Pacific have made laudable progress and now have larger average active customer bases than providers in SSA. Despite that, with approximately half of providers, active customers, and active agents as well as two-thirds of transaction volumes and values, SSA remains the clear bastion of mobile money. No other region has reached even half the prominence of SSA on any of the key indicators analyzed. Significant success in either Nigeria or Ethiopia will extend the region’s leadership.
Further, while relative growth in other regions eroded SSA’s leadership position on some key indicators in the past this trend seems to have abated and slowing global growth rates make it unlikely that it will continue in the foreseeable future. The proportion of providers in SSA has not decreased significantly in the last decade. Since 2016, about two-thirds of transactions (both volumes and values) have been in the region, and since 2017 about half of active customers have been in SSA. The proportion of agents in the SSA region is still increasing.
The North America region is not included in the GSMA analysis, and while Europe and Central Asia and the Middle East, and North Africa are included, they do not display sufficient prominence in any of the indicators to warrant discussion. The general industry wisdom has been that mobile money flourishes in lower-income countries where rudimentary payment systems do not yet exist for the mass market.
The above regions generally have more developed countries that have basic payment systems in place and therefore mobile money systems are not needed. While this all makes sense, recent data from the World Bank’s 2021 Global Findex pokes some holes in this theory, so it will likely need to be revisited. Further, analyzing the broader mobile payments space, it's obvious that solutions like Venmo and Cash App were welcomed solutions in the developed world, but because they are based on bank accounts are not considered mobile money solutions in the GSMA definition. As smartphone penetration, bank account access and internet connectivity improve at different rates across these regions it will be important to understand how solutions evolve and to update the definitions of how this industry is defined.
This analysis offers further depth to the age-old debate on why mobile money seems to work so much better in some places than others. The sector should understand why the regions of Latin America and Caribbean and Middle East and North Africa have launched a significant number of operations but failed to scale active customers or CICO agent networks. It is still a mystery why the regions of South Asia and East Asia and Pacific have such larger populations than SSA but proportionately fewer active customers. Why has the prominence of SSA stopped eroding and why are there such a disproportionate number of transactions there?
The regional analysis highlights how little is still understood about these issues as there is still no consensus on the degree to which these are supply-side issues regarding provider's strategic operations, or demand side issues about the relevance of the solution in different cultures and/or socio-economic contexts. Answering these questions may unlock impediments to a more even global distribution of success for mobile money or the realization that it is currently meeting its target market and other financial services are better designed to reach those mobile money does not. Either would be important conclusions. The next article will further investigate the demand side of this dynamic.
Reader’s Note: This article is part of a series that uses the last 15 years of mobile money to reflect on progress in the sector and gauge where we are in answering some of the big questions still being debated.
PLEASE READ THE OTHER ARTICLES IN THE SERIES HERE.
